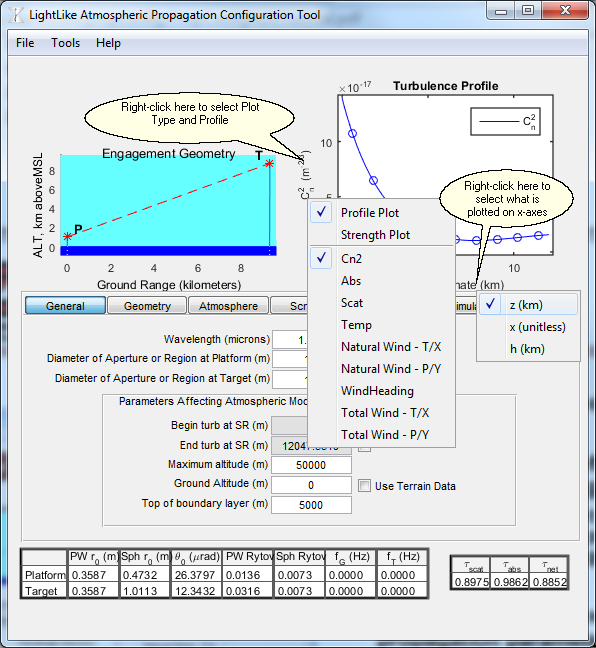
•Engagement Geometry Plot
This plot shows The Platform (P) and The Target (T) and dashed line for the laser beam path. The light blue color shows the atmosphere and the dark blue color shows The Earth. In the plot above The Earth looks flat because the Ground Range between The Platform and The Target is 10km. If we change the Ground Range (in the Geometry Panel) to be 300km or 500km, then the plots will look like this:

The Beam Path goes above The Earth

The Beam Path intersects The Earth
•Turbulence Plot
This plot shows either Turbulence Profile Plot or Turbulence Strength Plot - depending on the user's selection. The user can select the plot type and turbulence profile via right-click context menu on the y-axis label. The user can also select whether the turbulence profile or turbulence strength is plotted against the range, unitless (normalized) coordinates, or altitude.